Seattle, with its history and charms, is also risky. South Lake Union, Northgate, and Central District should be avoided. From Haller Lake to Sand Point, here are the city’s most dangerous locations.

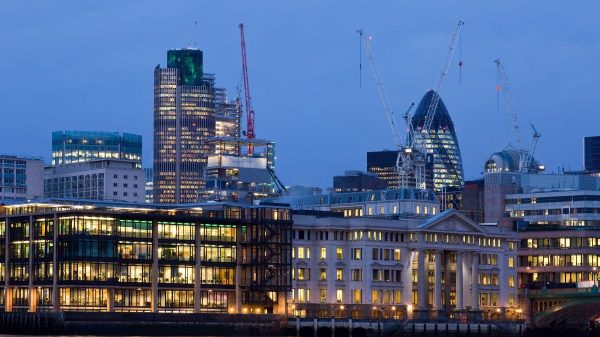
A view of Seattle (Photo: Google)
Seattle’s Safety Duality: A City of Contrasts and Caution
Seattle, known for its attractions and gentrification, has problems in certain areas. The Central District, Capitol Hill, Lower Queen Anne, Haller Lake, Northgate, Atlantic, South Lake Union, First Hill, Belltown, and Sand Point are the most hazardous for property and violent crimes. Avoid these areas to avoid being victimized. Find out which Seattle neighborhoods are worse this year by checking the data.
Seattle is a status symbol for artists but also a city with escalating drug use and violence. One district is luxurious while the other is unsafe, dividing the city. Seattle is typically secure for visitors, but its placement among America’s 50 most dangerous cities advises caution. Motor vehicle theft and assault are the main offenses. Knowing the safest neighborhoods is vital for an enjoyable experience, especially for families migrating to Seattle.
Seattle’s main districts are safe, while the outskirts and industrial areas are more dangerous. Police estimates of crime were used to determine Seattle’s most hazardous areas.
READ ALSO: Most Dangerous Neighborhoods in Atlanta: 2023’s Ultimate List
10. Central District
Population: 16,895
Property Crime per 100k people: 5,143
Violent Crime per 100k people: 872
Total Crime: 156% higher than the national average
9. Capitol Hill
Population: 37,489
Property Crime per 100k people: 7,120
Violent Crime per 100k people: 885
Total Crime: 241% higher than the national average
8. Lower Queen Anne
Population: 11,479
Property Crime per 100k people: 7,259
Violent Crime per 100k people: 941
Total Crime: 250% higher than the national average
7. Haller Lake
Population: 8,563
Property Crime per 100k people: 9,326
Violent Crime per 100k people: 1,129
Total Crime: 346% higher than the national average
6. Northgate
Population: 4,283
Property Crime per 100k people: 10,545
Violent Crime per 100k people: 1,499
Total Crime: 413% higher than the national average
5. Atlantic
Population: 5,133
Property Crime per 100k people: 9,074
Violent Crime per 100k people: 1,538
Total Crime: 352% higher than the national average
4. South Lake Union
Population: 6,331
Property Crime per 100k people: 8,996
Violent Crime per 100k people: 1,551
Total Crime: 350% higher than the national average
3. First Hill
Population: 12,112
Property Crime per 100k people: 10,256
Violent Crime per 100k people: 1,787
Total Crime: 413% higher than the national average
2. Belltown
Population: 10,468
Property Crime per 100k people: 11,614
Violent Crime per 100k people: 1,992
Total Crime: 480% higher than the national average
1. Sand Point
Population: 703
Property Crime per 100k people: 8,869
Violent Crime per 100k people: 2,862
Total Crime: 389% higher than the national average
Despite its nice working-class character, Sand Point in Seattle has a major downside. This 700-person community has violent crime rates roughly seven times the national average. Sand Point would have 2,862 violent offenses per year at 100,000 people.
One in 35 Sand Point residents may experience a violent crime, which is alarming.
READ ALSO: The 15 Most Dangerous Neighborhoods In DC: 2022’s Ultimate List


